What changed
This summer showed what it costs close to home. Bloomberg Economics estimates that Europe’s heatwaves cut EU GDP by about 0.17% between April and September, close to €17bn, about two and a half times the average for those months over the previous decade. The wider evidence points the same way:
- Local events now drive the losses. Swiss Re puts 2025 economic losses from natural catastrophes at $220bn. Floods, storms and wildfires made up a record 92% of insured losses.
- Much of the loss is uninsured where suppliers are. In emerging economies, 80–90% of catastrophe losses are typically uninsured. An uninsured supplier recovers more slowly.
- Disruption alerts are rising. Achilles tracks more than 200,000 suppliers. Its natural hazard alerts rose about 27% in 2025.
- Few companies look. Research cited by Deloitte finds about half of companies assess their suppliers’ exposure, and about a fifth have an adaptation plan.
- Regulators model the spread. The NGFS short-term scenarios show a regional disaster spreading through trade. In one region, GDP losses peak at 12.5%.
The WEF Global Risks Report 2026 ranks extreme weather third for 2026 and first over ten years.
What it puts at risk
Revenue
A heatwave doesn’t have to close a supplier’s plant to cut its output. Any supplier outage becomes yours once your safety stock runs out. Customers who can’t wait buy elsewhere, and some don’t come back.
Cost
Spot buying, air freight and overtime fill the gap at a premium. Insurance premiums and deductibles rise as losses grow.
Cash
The usual answer is more buffer stock across the board. That ties up working capital in inputs that were never at risk.
Continuity
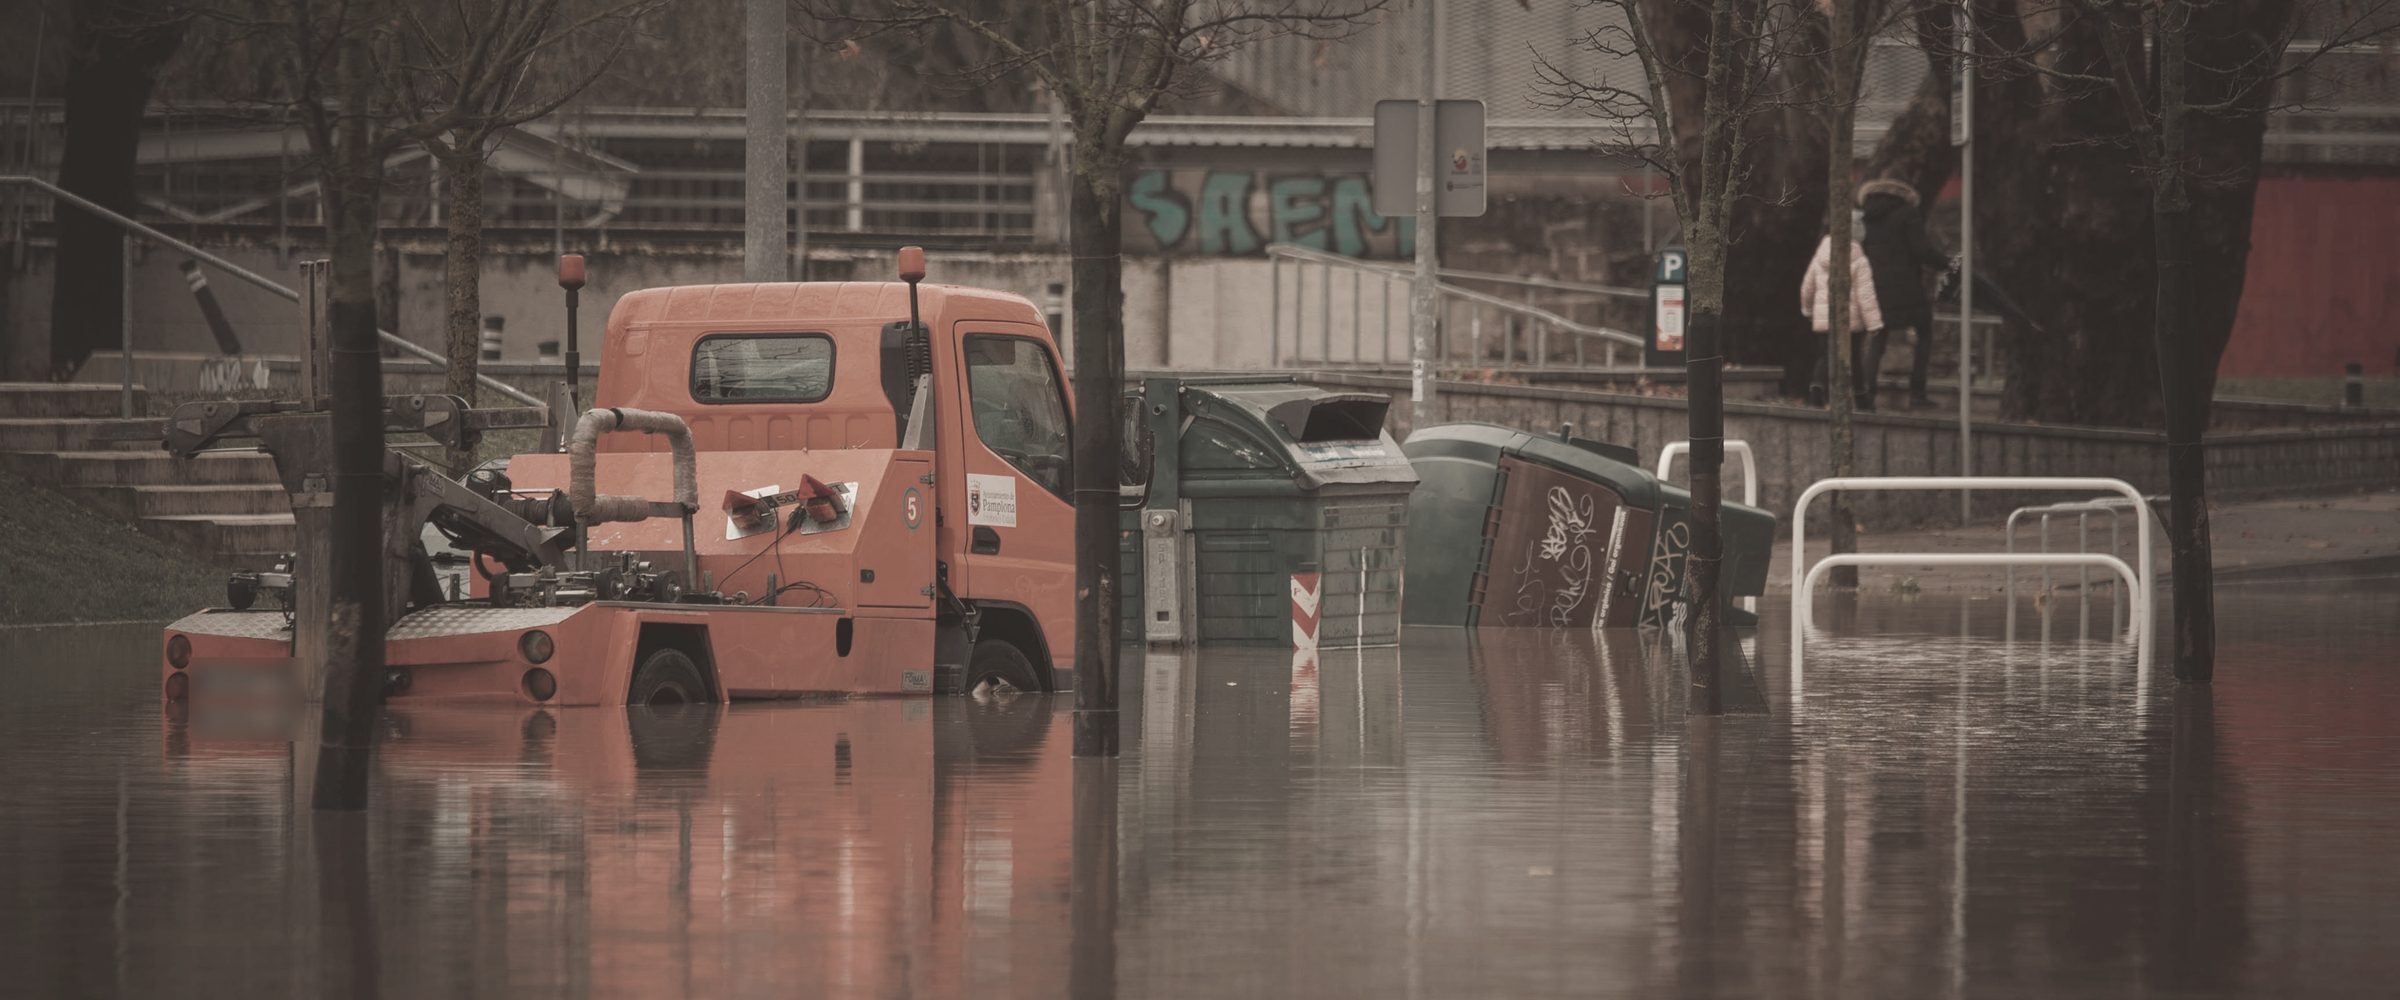
A flood at a tier 2 supplier can take months to clear if the plant is uninsured. In most categories, a new source takes longer than that to qualify.
Our view
Physical climate risk is mostly a supplier problem, and most risk registers still treat it as a property problem.
You don’t need a full climate model to start. Find the 10 to 20 inputs that would stop your line, and check where each is made and how exposed that site is to flood, heat and water stress. Then estimate a range for each: the weeks of output lost, the revenue behind them, and the stock needed to cover the gap.
The result is a short list. Put buffer stock and second sources where the list says, and nowhere else. That protects revenue without locking cash into inputs that were never at risk.
This is our reading of published loss and scenario data, not a forecast for any company.
Three questions for the board
- Which of our critical inputs come from sites exposed to flood, extreme heat or water stress?
- If one of those sites stopped for eight weeks, how much revenue would we lose before we could switch?
- Is our buffer stock placed against the inputs most at risk, or spread evenly?
Sources
Swiss Re sigma on 2025 natural catastrophe losses
Achilles supply chain disruption analysis (Mar 2026)
Deloitte, citing S&P Global and CDP
NGFS short-term climate scenarios (May 2025)
WEF Global Risks Report 2026
Bloomberg Economics, reported in Bloomberg Green (23 Oct 2026)
Photo: Juan Manuel Sanchez on Unsplash.